MarketCrash Dashboard
Real-time economic indicators dashboard tracking market crash probability through Buffett Indicator, Yield Curve, and Shiller PE Ratio.
Overview
A real-time dashboard that answers the question every investor secretly asks: “Is the market about to crash?” Built as a weekend project that turned into a valuable learning experience.
Key Features
- Buffett Indicator: Total market cap to GDP ratio — Warren Buffett’s favorite valuation metric
- Yield Curve Spread: 10Y-2Y Treasury spread tracking recession probability
- Shiller PE Ratio: Cyclically adjusted P/E for long-term market valuation
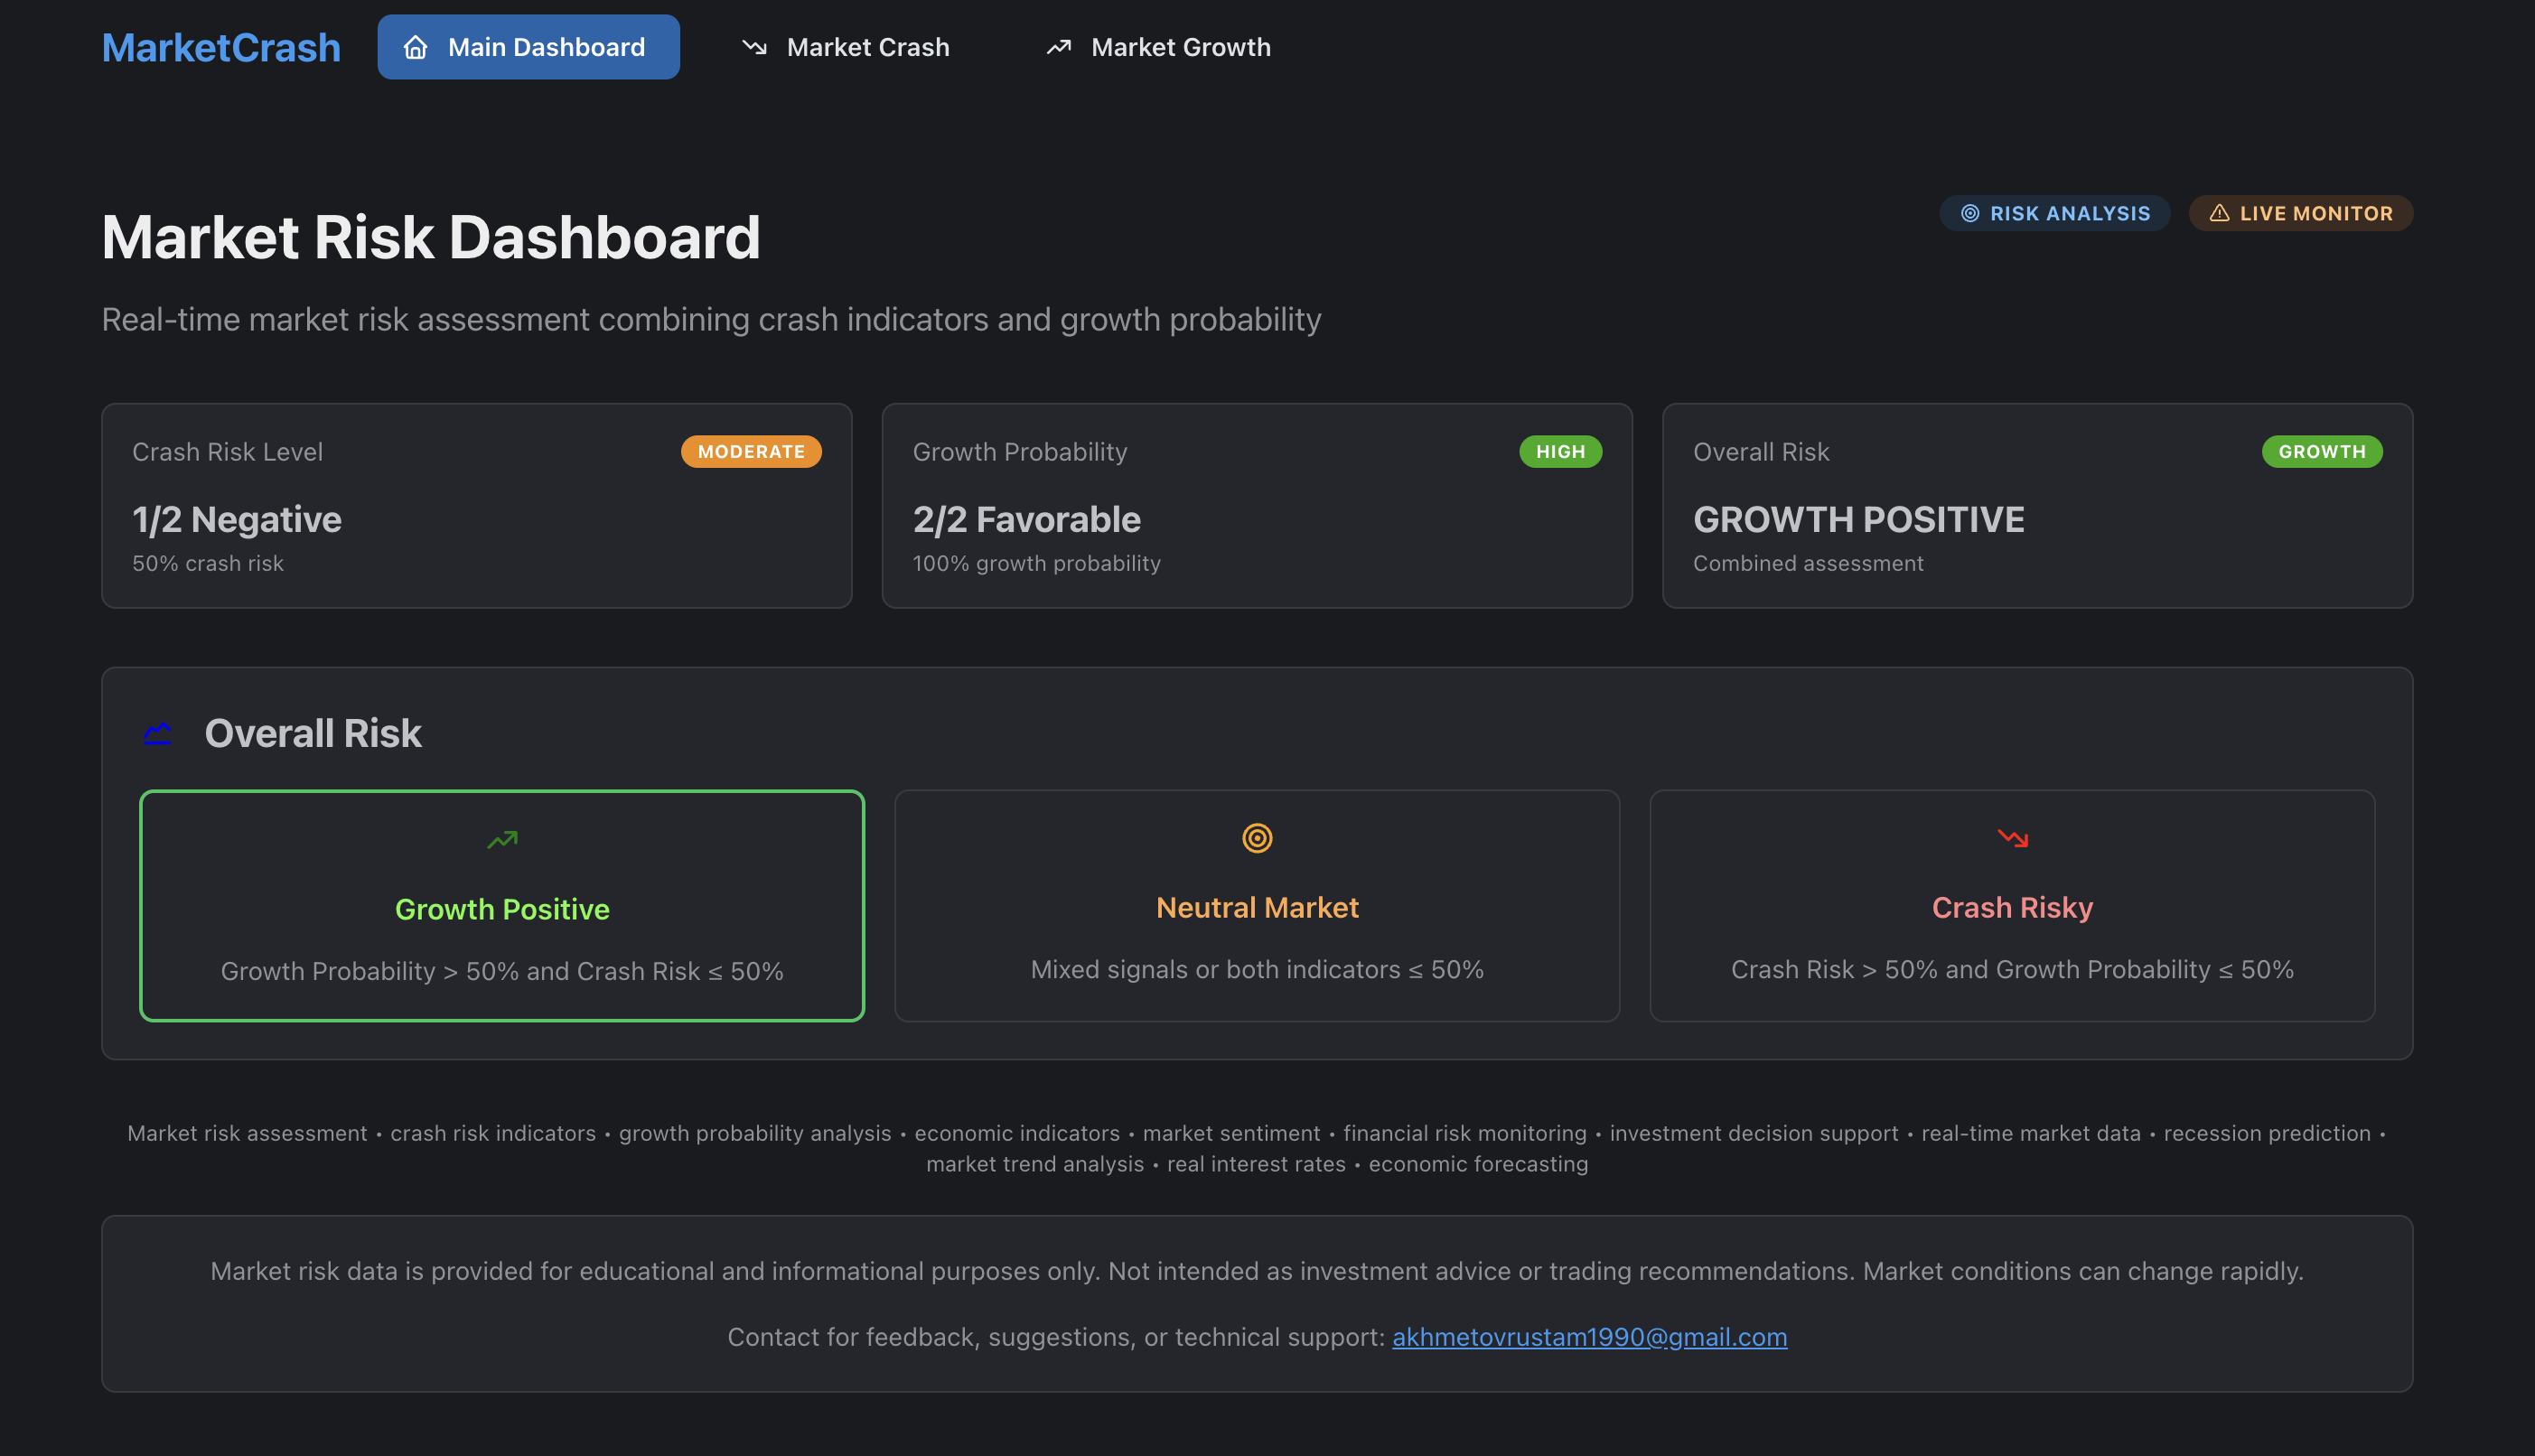
- Visual Risk Meter: Simple, intuitive display of current market conditions
The Next.js Reality Check
This project taught me an important lesson about framework choice. While Next.js is powerful, the user experience suffered from noticeable slowness — page transitions felt sluggish, and the JavaScript bundle size impacted initial load times significantly.
For a content-focused dashboard that doesn’t need heavy client-side interactivity, Next.js was overkill. The SSR overhead and hydration costs weren’t justified for what is essentially a data display application.
This experience directly led me to choose Astro for my next project — prioritizing performance and user experience over framework popularity.